
Like most IT Professionals, I have tried, tested and benefited from a plethora of nifty tools over the years. Some good, some bad… and some, well just down right ugly! Anyway, I have compiled a short list, seven to be exact which are freely available (or at least have a free version) that may be of use to you.
If you are seasoned IT Pro, the chances are you will be familiar with some but probably not all of these. I have included a short description, use case and download link for each. Hopefully some make it into your array of resources!
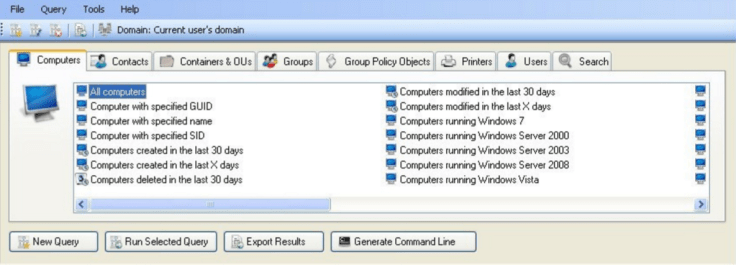
AD Info:
AD Info can be used to query and report on your Active Directory domains by simply pulling info on AD object such as users, computers, groups and printers. You achieve this using 190+ built in queries with the option of creating your own custom queries and reports.
Use case: This has came in handy in a number of scenarios, including the on-boarding of new clients, Active Directory health checks / reporting and troubleshooting the likes of permission issues and Active Directory replication consistency.
http://ad-info-free-edition1.software.informer.com/1.7/
LAN Speed:
A simple but powerful tool for measuring file transfer, hard drive, USB Drive, and Local Area Network (LAN) speeds (wired & wireless). It does this by building a file in memory, then transfers it both ways (without effects of windows file caching) while keeping track of the time, and then does the calculations for you. Simple concept and easy to use.
Use case: Use this tool to ensure you are getting the expected throughput on the LAN. I recently had success in finding the cause of poor Citrix profile synchronization. I ran LAN Speed between one of the affected application servers and the target profile server and noticed I wasn’t getting anywhere near the 1Gb expected transfer rates, it turned out to be a duplex mismatch on a handful of switch ports.
http://www.totusoft.com/lanspeed1.html

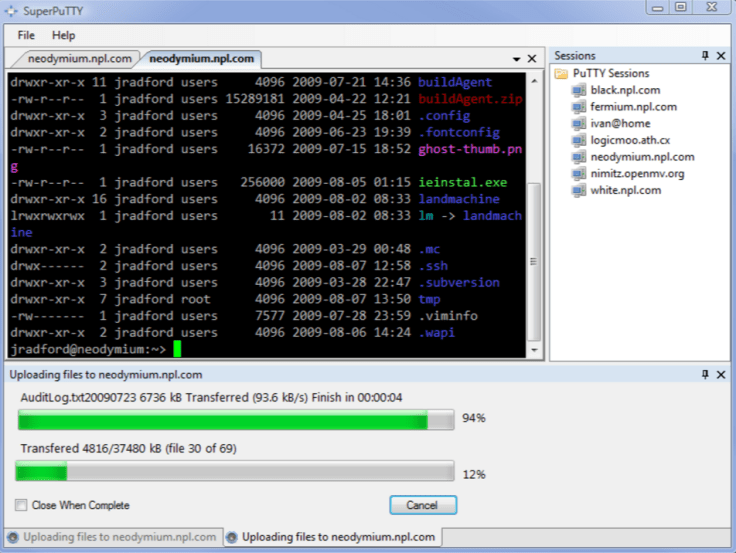
SuperPutty:
SuperPuTTY enhances the capabilities of the PuTTY SSH and Telnet client by allowing you to launch it in multiple tabs. It offers you the possibility to easily manage multiple sessions of PuTTY using a single, comprehensive working environment.
Use case: Troubleshoot and easily compare multiple configurations from within a single window.
https://github.com/jimradford/superputty
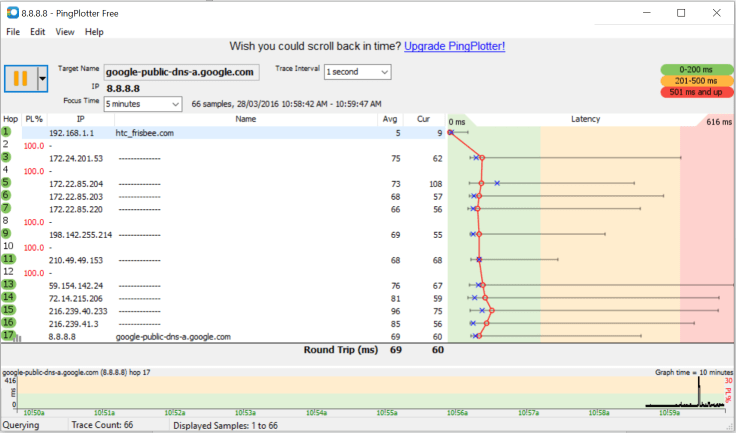
PingPlotter:
PingPlotter helps pinpoint network problems in an intuitive graphical way and continues monitoring connections long-term to further identify issues.
Use case: This is my go-to tool for measuring network latency, it’s quite basic but it normally provides enough information to confirm if the network is at fault or not. I had frequent headaches with a load of branch sites connected to head office over a site-to-site IPSEC tunnels. A quick report from this was enough to prove the server infrastructure innocent and build a case for an MPLS network as the business network requirements had grown over the course of 12 months.
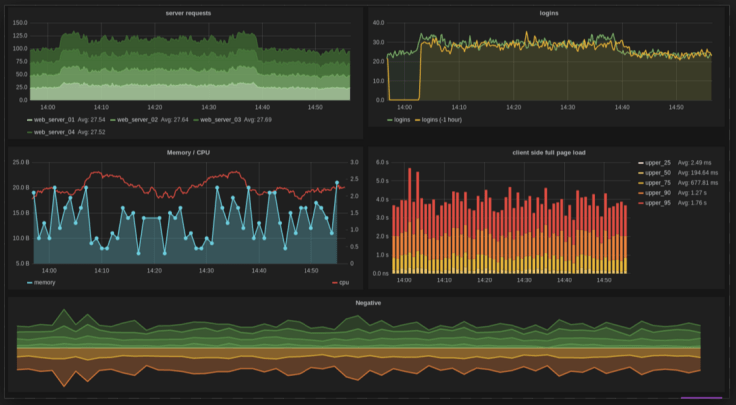
Grafana:
Grafana provides a powerful and elegant way to create, explore, and share dashboards and data. It’s most commonly used for visualizing time series data for Internet infrastructure and application analytics but many use it in other domains including industrial sensors, home automation, weather, and process control.
Use case: Grafana could be a slick front end to your existing monitoring solution, it’s much richer looking than most built in dashboards from ‘off the shelf’ products. I have ran it to monitor server infrastructure in short cycle / load testing projects using some other components to complete the temporarily solution. Those being, Centos for the OS, InfluxDB and Telegraf for database services and metric collection . I will try and put together a walk through on the set up soon…
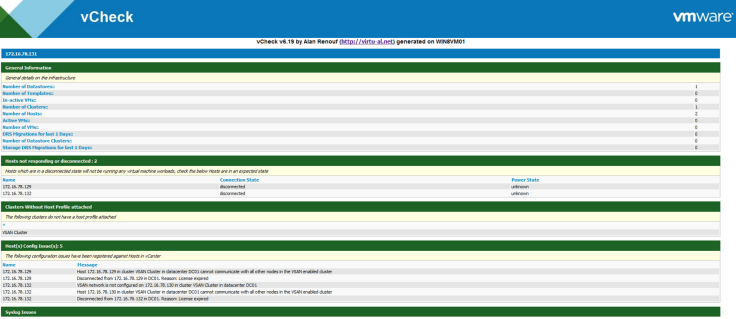
vCheck:
vCheck (Daily Report) is an awesome Powershell script developed by Alan Renouf of VMware. vCheck produces an HTML report on the status of your vSphere environment.
Use case: Configure a daily scheduled task to run vCheck against your vSphere infrastructure, the report can be emailed to the Service Desk / Engineering teams before the start of business so that problems can be resolved early, mitigating impact to service.
http://www.virtu-al.net/vcheck-pluginsheaders//vcheck//
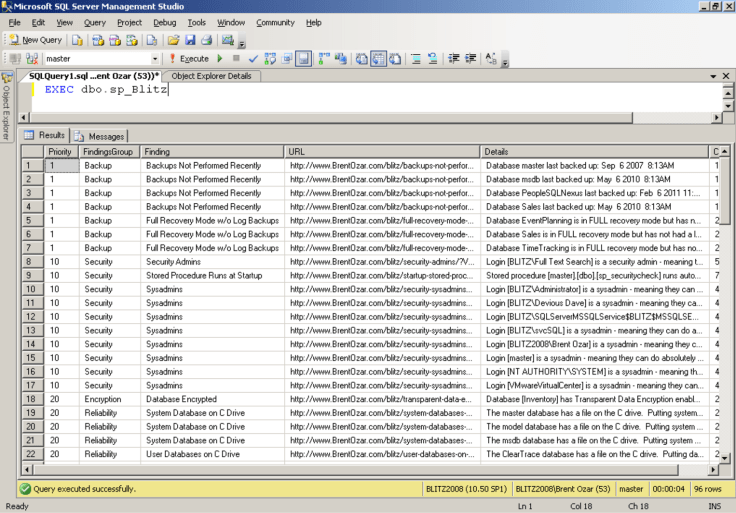
SP_Blitz:
SP_Blitz can quickly flag common SQL Server issues in a matter of seconds, it prioritizes the problems with what’s broken or dangerous giving you a clear view of what needs tackled first. I’ve never had any issues with SP_Blitz but if you are looking to adopt this, make sure your trial on a dev server before running in a production environment.
Use case: SP_Blitz is a great place to start when doing SQL server health checks. You can also run it as a scheduled task to automate regular checks on your SQL Server infrastructure and get the heads up before those issues become real problems and affect production services. The following link provides a 5 minute demo from the developer, Brent Ozar.
https://www.brentozar.com/blitz/
Go nuts and share…

Angry IP Scanner is also another “must-have” in my toolkit. http://angryip.org/download/#windows
LikeLike
Great stuff John!
LikeLike